1
Derivatives Rollover Report |January 1, 2021
For Private Circulation Only
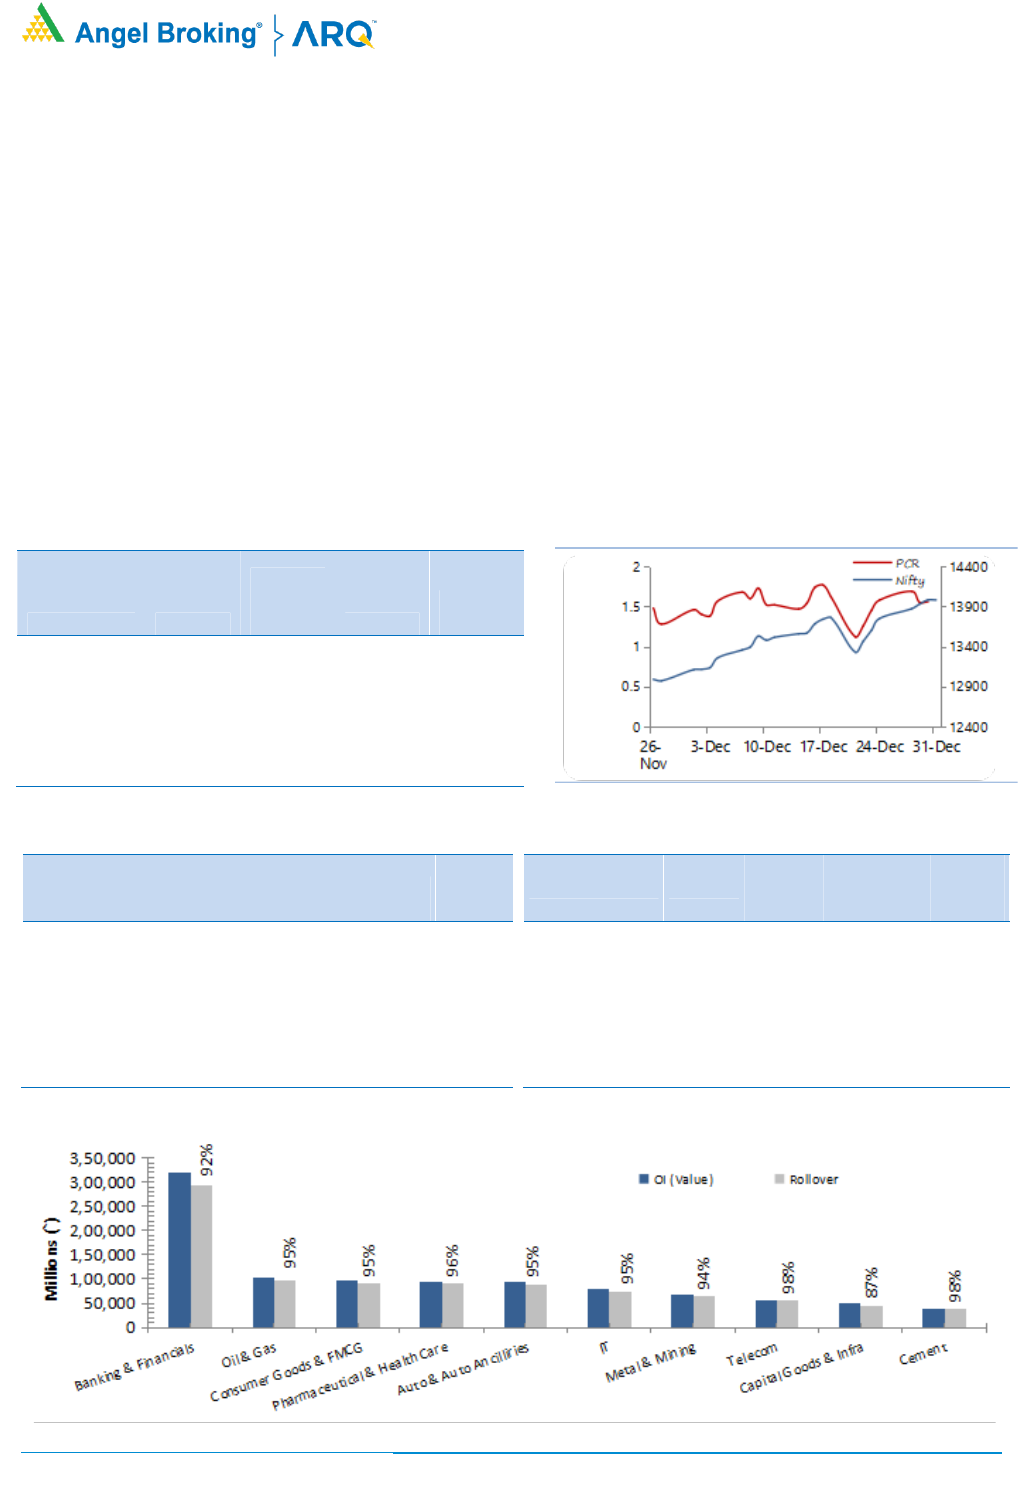
NIFTY & PCR Graph
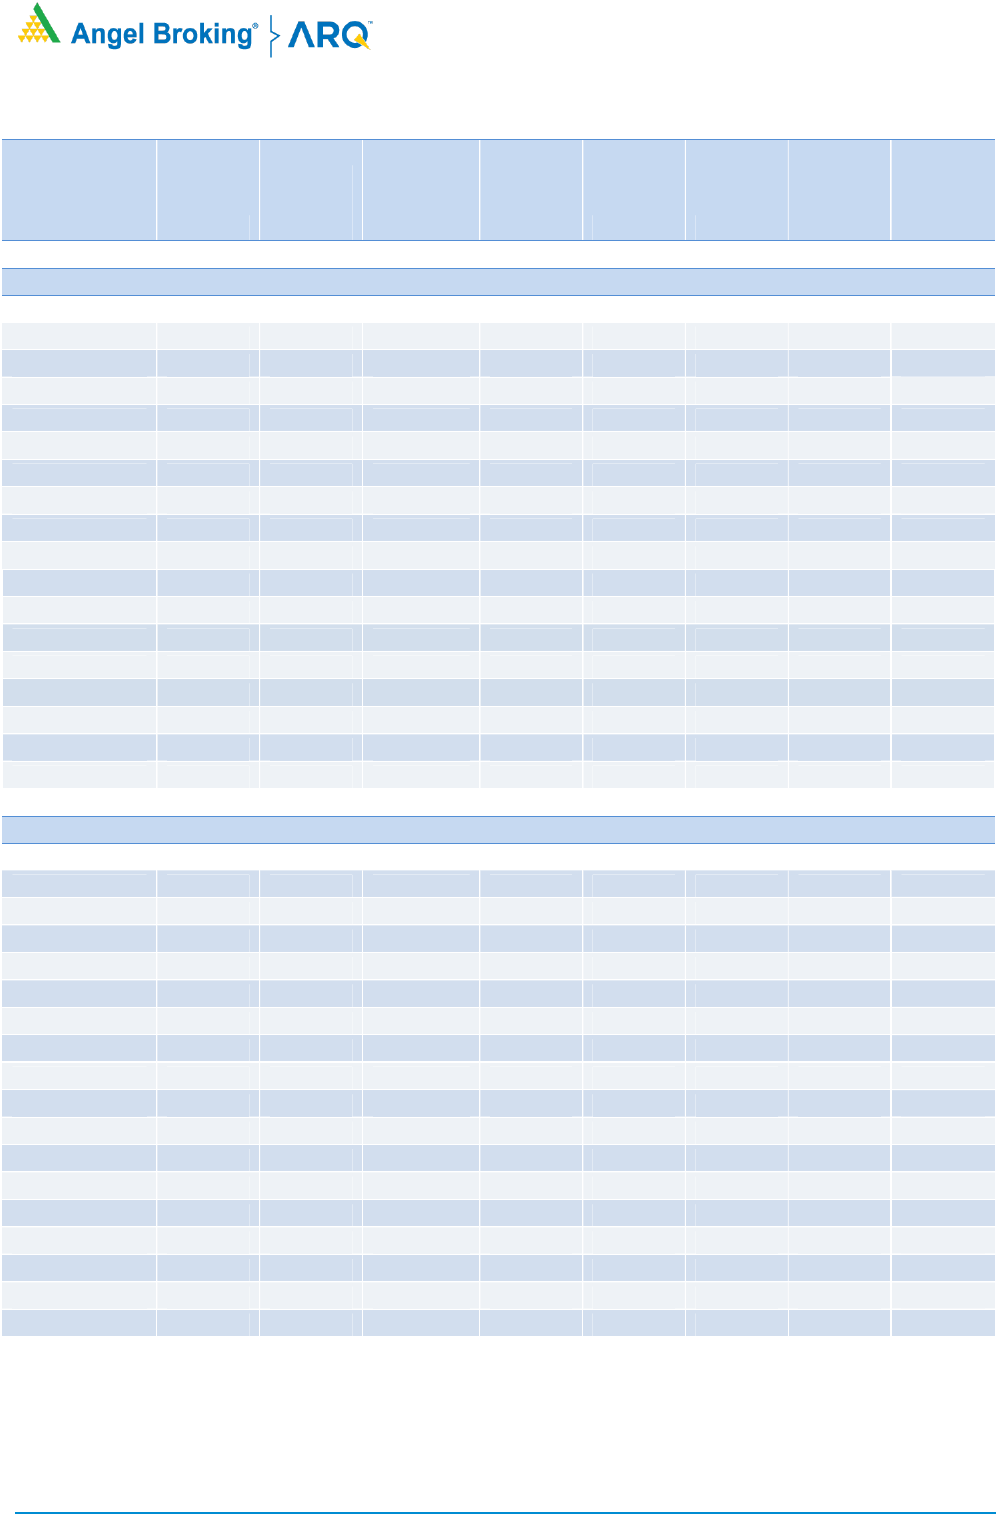
Monthly Gainers
Scrip Price
Price
Change
(%)
Open
Interest
Ol
Change
(%)
SAIL 74.35
58.53
104120000
104.40
VEDL 162.05
35.49
81127000
(29.11)
CANBK 130.50
30.04
47526400
194.89
GODREJPROP 1430.00
29.40
1250600
(8.34)
ASIANPAINT 2770.35
27.90
5374500
47.59
Note: Stocks which have more than 1000 contract in Futures OI.
Monthly Losers
Scrip Price
Price
Change
(%)
Open
Interest
Ol
Change
(%)
ESCORTS
1268.60
(9.07)
3551350
29.92
RAMCOCEM
799.45
(7.73)
1578450
9.36
AMBUJACEM
249.50
(4.64)
19644000
31.91
MANAPPURAM
166.05
(4.38)
17826000
(12.15)
ACC
1625.15
(4.36)
3453500
130.93
Note: Stocks which have more than 1000 contract in Futures OI.
Nifty started the December series around the 13000 mark and kept
making new records with formation of long positions. On 21
st
December,
the index corrected sharply
but we did not see any meaningful shorts and hence, the market started recovering in the very next session and it
resumed its upmove to end the December series around the 14000 mark.
During the series, we witnessed long formations in Nifty and the rollover is around 76 percent which is in line with its 3-
month average. This
indicates that long positions in the index have been rolled to the January series and market participants are expecting a con
tinuation of the
uptrend. FII’s continued to buy in the ca
sh segment in the month of December and formed good amount of longs in the futures segment as
well. They have rolled over
much of their long positions and their ‘Long Short Ratio’ at the start of this series is at 75 percent. Most of the
sectors participat
ed in the upmove in the December series and only few stocks ended on a negative note compared to their last series
closing.
At the start of the series, 13800 is likely to act as an important support for the index and till the support is intact traders sh
ould prefer to
trade with a positive bias and use declines as buying opportunities. On the higher side, 14200 will be the immediate level to watch.
Stock
specific movement could continue to provide good trading opportunities and hence, traders are advised to capitalize on the same.
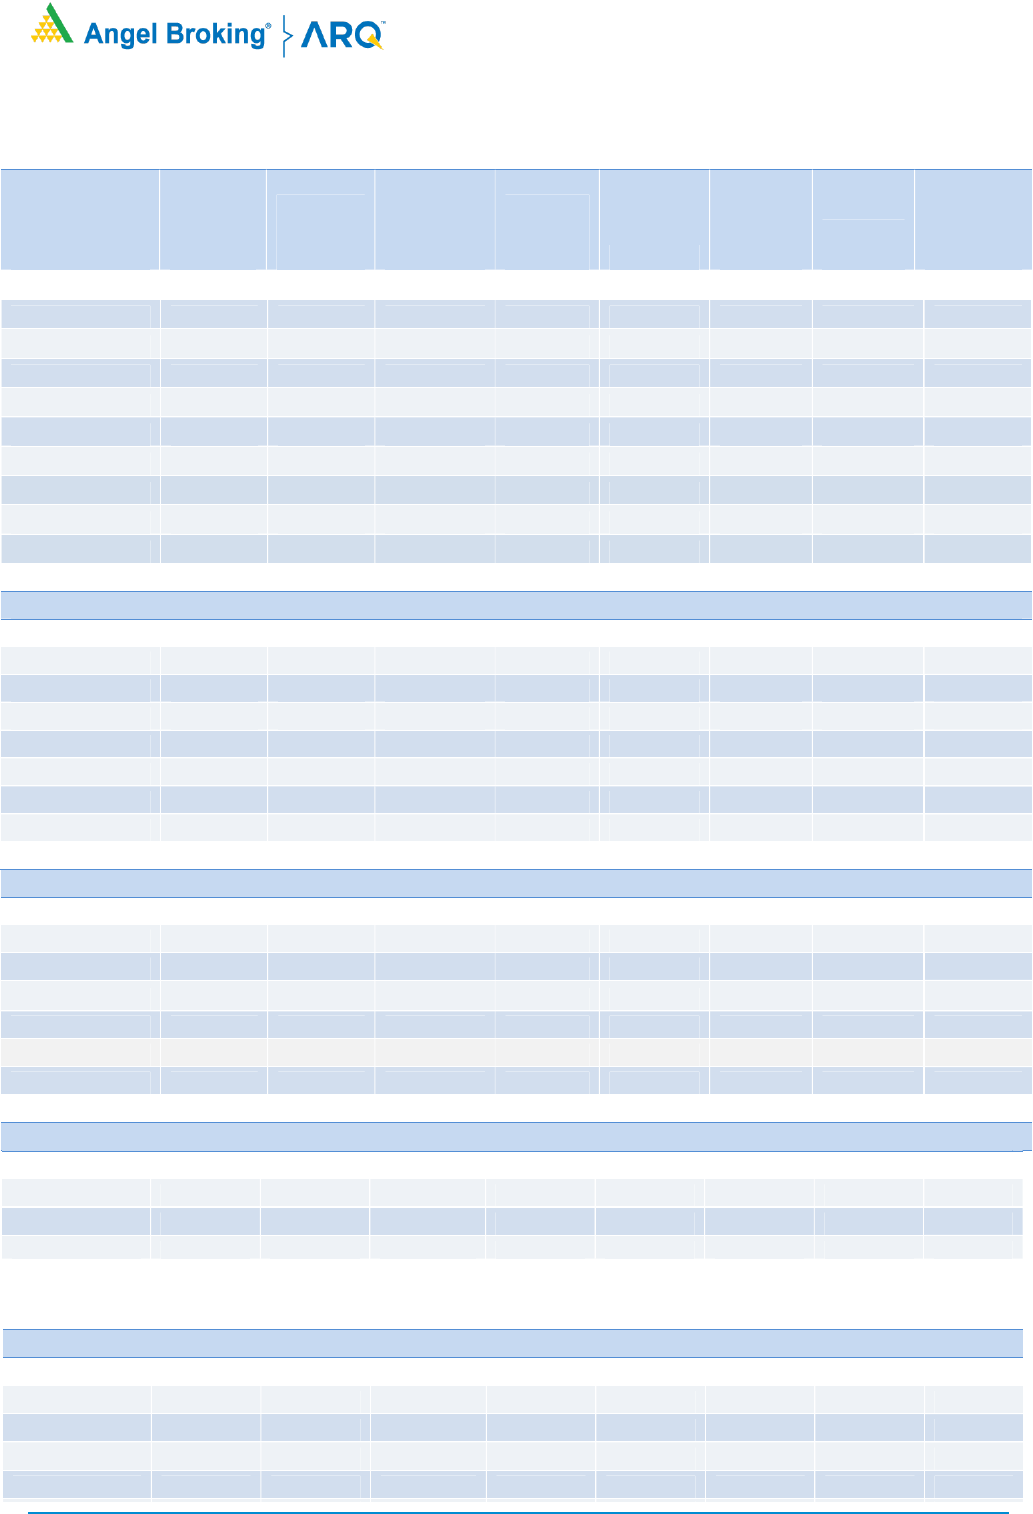
Indices Change
INDEX Price
Price
Change
(%) Rollover
3 month
avg.
NIFTY
13981.75 7.66
75.94
77.36
BANKNIFTY
31264.05 5.80
78.13
77.03
- - - - -
- - - - -
- - - - -
Derivatives Rollover Report
For Private Circulation Only
2
Scrip Price
Price
Change
(%) OI Futures
OI
Change
(%) COC (%) PCR-OI
Rollover
(%)
Average
Rollover
(3month)
(%)
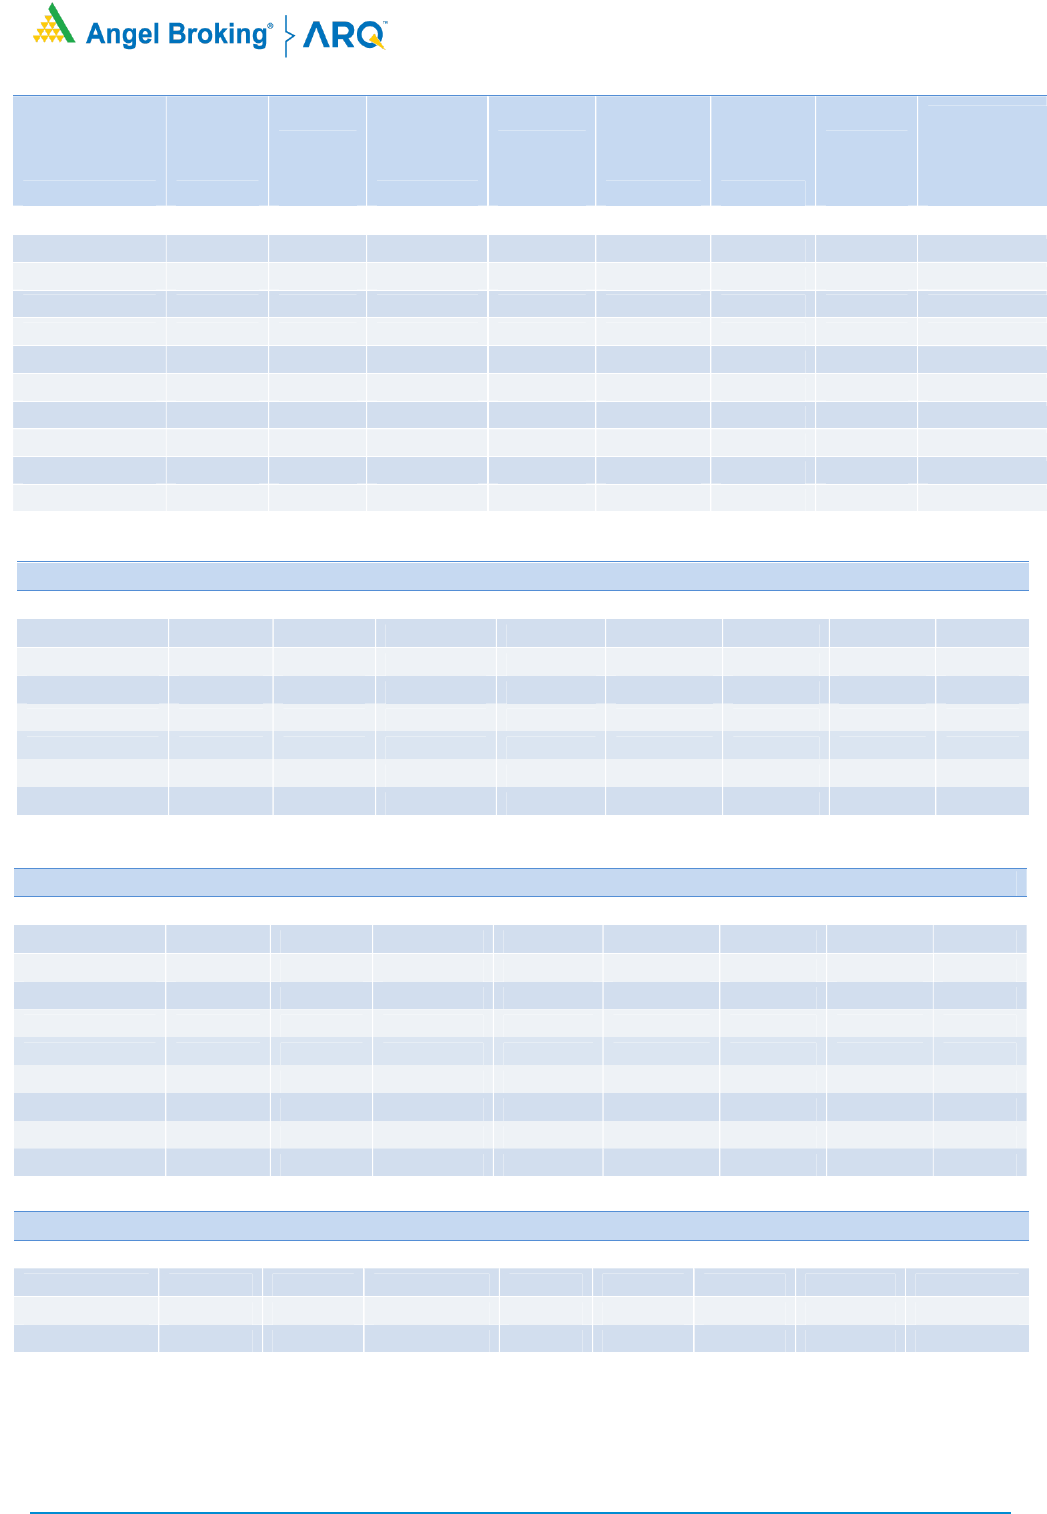
AUTO & AUTO ANCILLARIES
AMARAJABAT 921.30 3.60
1367000 32.85 -3.81 0.20 92.43 90.74
APOLLOTYRE 179.00 1.62
10585000 29.01 7.32 0.35 93.38 92.68
ASHOKLEY 95.95 7.21
41787000 28.30 6.83 0.64 93.44 92.36
BAJAJ-AUTO 3462.15 10.07
1610250 (22.51) 6.83 0.42 96.11 97.26
BALKRISIND 1652.60 2.28
1869200 42.43 5.03 0.49 98.32 94.93
BHARATFORG 526.35 2.05
5688000 7.36 2.61 0.48 97.48 94.07
BOSCHLTD 12837.70 2.45
142250 (50.42) 5.33 0.68 94.55 97.09
EICHERMOT 2536.50 (1.06) 2421650 12.43 2.88 0.28 98.79 97.37
ESCORTS 1268.60 (9.07) 3425950 46.46 8.48 0.48 96.47 92.56
EXIDEIND 192.15 10.56
12834000 2.35 6.13 0.38 97.54 95.00
HEROMOTOCO 3094.40 2.13
3486300 11.78 -6.54 0.69 97.72 97.21
M&M 724.00 (1.11) 10921400 (26.74) 6.15 0.53 87.97 93.20
MARUTI 7677.55 9.33
2385700 (23.67) 4.76 0.49 94.75 96.40
MOTHERSUMI 165.65 14.88
21399000 26.43 3.55 0.40 90.15 92.05
MRF 76105.55 0.38
44060 31.84 6.15 0.07 90.21 93.71
TATAMOTORS 184.65 5.15
69619800 19.77 5.67 0.52 96.76 90.04
TVSMOTOR 487.40 2.13
4053000 (19.92) 6.45 0.32 95.70 93.93
BANKING & FINANCIALS
AXISBANK 623.55 1.22
45578400 (13.01) 6.51 0.73 93.31 95.27
BAJAJFINSV 8947.60 1.27
782125 (13.79) 6.04 0.45 84.34 90.19
BAJFINANCE 5288.65 9.61
5150500 3.34 -1.62 0.74 91.05 92.96
BANKBARODA 61.20 18.83
54323100 (7.36) -5.30 0.63 90.22 93.96
CANBK 130.50 30.04
38426400 165.80 15.67 1.56 80.85 88.80
CHOLAFIN 389.25 7.75
4400000 (2.00) 5.38 0.32 88.53 85.81
FEDERALBNK
67.05
11.38
8868
0000
(10.97)
6.84
0.52
97.63
96.76
HDFC 2563.45 14.04
18804300 (28.16) 2.45 0.63 90.34 95.24
HDFCBANK 1439.10 0.93
25794450 (11.87) 2.54 0.76 93.35 94.58
IBULHSGFIN 221.55 18.44
31328600 91.87 7.40 0.37 96.63 93.89
ICICIBANK 536.25 12.27
78221000 (32.89) 2.92 0.68 92.55 95.94
ICICIPRULI 499.90 9.54
4054500 (40.55) 2.74 0.35 94.98 94.23
INDUSINDBK 897.55 4.93
15964200 (3.42) 3.79 0.77 95.46 95.47
KOTAKBANK 1993.70 5.70
18320400 23.49 -1.24 0.77 96.26 95.24
L&TFH 93.20 19.33
19986400 (27.33) -6.96 0.57 87.58 83.82
LICHSGFIN 362.95 10.98
6636000 (43.39) 6.13 0.52 94.05 94.57
M&MFIN 175.80 4.64
13140000 (25.16) 6.71 0.39 95.16 94.63
Derivatives Rollover Report
For Private Circulation Only
3
Scrip Price
Price
Change
(%) OI Futures
OI
Change
(%) COC (%) PCR-OI
Rollover
(%)
Average
Rollover
(3month)
(%)
MANAPPURAM 166.05 (4.38) 17112000 (13.34) 4.33 0.58 95.99 92.46
MFSL 677.15 5.62
7192900 86.30 4.25 0.34 96.23 95.93
MUTHOOTFIN 1213.50 6.72
4234500 (19.07) 3.18 0.45 95.07 95.71
PFC 114.65 4.85
23876200 (22.00) 3.99 0.51 85.12 82.87
PNB 33.35 3.41
36160000 (44.23) 11.83 0.65 44.02 77.67
RBLBANK 229.85 3.05
15268500 (20.22) -6.77 0.59 96.33 94.68
RECLTD 134.50 9.80
14220000 (36.51) 5.84 0.66 93.71 93.45
SBIN 275.55 11.74
64272000 (26.68) 2.84 0.76 83.86 90.32
SRTRANSFIN 1051.85 (0.10) 4190400 33.80 6.66 0.27 91.88 89.23
CAPITAL GOODS & INFRASTRUCTURE
ADANIPORTS 485.45 17.83
39770000 (25.57) 4.58 0.30 77.56 91.56
BHEL 36.05 13.90
102963000 45.06 5.45 0.44 96.35 94.73
GMRINFRA 26.70 2.89
148387500 143.00 9.84 0.25 98.13 97.13
HAVELLS 919.25 13.75
3313000 (14.55) 4.41 0.47 88.75 89.76
LT 1292.75 14.82
13986300 (2.33) 5.21 0.48 95.63 95.07
SIEMENS 1578.80 3.36
867900 (50.21) 2.69 0.35 62.15 83.43
VOLTAS 828.35 7.47
1875000 (29.51) 4.26 0.52 94.13 91.47
CEMENT
ACC 1625.15 (4.36) 3348500 134.32 6.04 0.48 96.96 92.81
AMBUJACEM 249.50 (4.64) 19140000 32.86 3.40 0.37 97.43 94.18
GRASIM 931.65 5.93
18341650 (1.51) 5.34 0.43 98.80 98.72
RAMCOCEM 799.45 (7.73) 1530850 9.88 4.99 0.08 96.98 97.13
SHREECEM 24122.75 (1.51) 155600 16.08 5.94 0.02 98.57 97.28
ULTRACEMCO 5299.95 8.96
1326200 (24.62) 2.92 0.30 95.45 96.16
CHEMICAL & FERTILIZERS
CHEMICALS & FERTILIZERS
PIDILITIND 1771.70 14.75
2741500 (10.85) 4.47 0.48 89.36 94.08
TATACHEM
479.45
24.99
6744000
68.77
5.60
0.36
91.21
90.82
UPL
468.45
10.78
193401
00
(18.46)
5.87
0.58
96.48
96.63
Consumer Goods & FMCG
ASIANPAINT 2770.35 27.90
5015700 40.12 2.76 1.25 93.32 94.64
BERGEPAINT 761.85 18.74
2114200 (12.36) 4.12 0.65 91.39 87.83
BRITANNIA 3590.10 0.67
2220000 64.10 5.03 0.69 97.98 93.05
COLPAL 1571.95 2.89
2513000 37.39 5.58 1.14 92.17 91.61
CONCOR
556.00
(5.86)
7139784
40.51
7.43
0.32
99.05
94.03
Derivatives Rollover Report
For Private Circulation Only
4
Scrip Price
Price
Change
(%) OI Futures
OI
Change
(%) COC (%) PCR-OI
Rollover
(%)
Average
Rollover
(3month)
(%)
DABUR 535.85 5.98
15278750 1.07 4.52 0.41 96.56 97.02
GODREJCP 742.05 5.48
5491000 43.29 3.35 0.29 98.58 92.64
HINDUNILVR 2405.35 11.29
5247900 (24.05) 5.44 0.79 94.17 96.55
ITC 209.95 7.31
89283200 (4.31) 5.93 0.44 95.45 94.60
JUBLFOOD 2796.30 11.39
1443250 (23.04) 2.41 0.29 92.40 92.30
MARICO 404.15 7.49
9162000 (3.21) 4.86 0.36 95.16 95.67
MCDOWELL-N 579.60 3.54
10832500 0.36 3.04 0.51 98.37 98.07
NESTLEIND 18459.00 4.07
286700 27.08 4.87 0.70 98.02 87.93
TATACONSUM 592.05 13.22
12255300 (10.15) 4.75 0.40 95.81 95.97
TITAN 1568.65 17.53
5594250 (3.04) 1.25 0.50 93.72 95.51
UBL
1174.20
11.57
1362200
11.01
-
13.35
0.13
93.07
90.99
METALS & MINING
COALINDIA 135.90 7.99
27568800 (7.56) 4.33 0.48 76.86 84.91
HINDALCO 241.10 4.37
26956700 (6.05) 2.98 0.56 89.72 92.74
JINDALSTEL 267.60 6.61
24365000 (0.57) 5.63 0.21 96.99 96.33
JSWSTEEL 388.90 7.88
33566400 (11.17) 5.72 0.40 95.62 96.95
NATIONALUM 43.35 15.45
55794000 118.65 7.56 0.56 95.27 84.47
NMDC 115.10 18.78
34337500 10.74 7.40 0.48 85.65 83.97
SAIL 74.35 58.53
93499000 117.36 4.40 1.04 89.80 90.29
TATASTEEL 646.15 13.03
38231300 (2.82) 5.06 0.93 96.73 96.73
VEDL 162.05 35.49
77283000 (29.45) 5.25 0.92 95.26 93.70
Media
PVR 1294.15 (1.06) 1531948 26.48 -25.72 0.31 92.12 87.25
SUNTV
482.80
14.14
10011000
77.78
5.56
0.61
93.88
95.15
ZEEL 224.15 17.60
29100000 (7.04) 3.79 0.37 93.17 95.00
INFORMATION TECHNOLOGY
HCLTECH 944.65 11.82
18694900 (3.64) -2.07 0.43 96.93 97.46
INFY 1258.40 12.54
34708800 (10.30) 2.70 0.64 95.80 96.41
MINDTREE 1663.70 18.76
1239200 (13.56) 2.71 0.55 87.22 88.32
COFORGE 2714.20 10.12
333375 (37.39) 4.36 0.22 91.46 84.93
TCS 2878.50 5.33
5907000 1.12 6.83 0.93 96.55 90.68
TECHM 976.85 13.28
10836000 5.13 4.89 0.50 91.55 94.56
WIPRO 386.75 9.25
26371200 8.04 1.69 0.53 90.90 89.64
Derivatives Rollover Report
For Private Circulation Only
5
Scrip Price
Price
Change
(%) OI Futures
OI
Change
(%) COC (%) PCR-OI
Rollover
(%)
Average
Rollover
(3month)
(%)
INFORMATION TECHNOLOGY
HCLTECH 564.00
(0.70)
22885800
(1.26)
8.14
0.58
98.56
96.78
INFY 730.55
3.77
24351600
(52.50)
2.86
0.74
55.98
79.52
MINDTREE 782.95
10.93
1041600
(14.29)
-15.63
0.59
93.13
93.37
NIITTECH 1606.65
6.68
578250
26.08
-2.03
0.46
89.76
82.99
TCS 2212.80
6.19
15671500
(17.22)
6.42
1.91
95.02
94.74
TECHM 775.75
1.00
15406800
8.21
9.05
0.65
96.29
97.15
WIPRO 249.90
3.65
18211200
(29.64)
-2.08
0.72
83.12
92.60
MISCELLANIOUS
ADANIENT 481.40 19.56
18598000 12.95 5.17 0.60 98.25 97.90
APOLLOHOSP 2417.20 4.56
1817000 27.06 2.40 0.40 90.51 89.14
BATAINDIA 1586.90 3.49
1064250 2.87 6.02 0.33 94.95 92.75
BEL 120.35 9.91
31236000 8.30 4.35 0.55 96.25 94.86
CONCOR 400.15 (2.40) 10958193 103.51 2.77 0.68 98.04 97.22
CUMMINSIND 577.05 7.83
1723200 55.08 5.67 0.33 95.23 90.67
INDIGO 1712.50 10.45
2911500 (4.74) -8.17 0.61 87.59 92.13
OIL & GAS
BPCL 381.70 0.41
24962400 28.81 2.05 0.66 90.80 91.54
GAIL 123.45 19.68
26675300 40.52 2.12 0.44 87.29 87.12
HINDPETRO 218.30 2.01
27294300 1.60 2.39 0.72 96.93 95.51
IGL 504.80 12.57
7379625 86.29 6.36 0.28 97.40 95.54
IOC 91.25 6.10
46312500 (5.63) 4.30 0.51 89.47 91.23
MGL
1066.00
14.00
1275600
(1.07)
5.90
0.50
90.85
93.76
ONGC 93.40 16.10
50080800 26.59 4.90 0.41 89.14 87.75
PETRONET 248.75 (3.42) 15453000 57.09 6.05 0.34 98.66 84.57
RELIANCE 1993.65 1.76
32004750 (10.91) 5.48 0.63 96.28 94.94
PHARMACEUTICAL
AUROPHARMA 924.05 5.81
10132200 (13.97) 3.89 0.48 98.45 97.00
BIOCON 466.65 8.94
10522500 4.38 3.50 0.54 96.23 96.55
CADILAHC 479.05 12.62
9378600 55.58 6.29 0.55 96.49 96.21
CIPLA 822.90 10.75
15575300 (8.74) 4.69 0.53 95.82 96.66
DIVISLAB
3853.80
8.22
2489600
10.75
4.02
0.44
91.33
94.86
DRREDDY 5226.55 6.27
2524375 (29.97) 5.37 0.60 96.59 97.30
GLENMARK 495.70 5.08
5347500 (2.06) 5.81 0.41 97.32 96.84
LUPIN 980.80 8.39
7769850 (12.27) 5.27 0.54 95.68 88.53
PEL 1434.25 0.13
4232800 48.06 5.06 0.75 98.59 96.62
SUNPHARMA 593.60 15.58
44830800 2.91 2.75 0.52 97.14 96.87
TORNTPHARM 2812.40 7.14
727500 (20.60) 4.53 0.11 97.32 97.84
Derivatives Rollover Report
For Private Circulation Only
6
Scrip Price
Price
Change
(%) OI Futures
OI
Change
(%) COC (%) PCR-OI
Rollover
(%)
Average
Rollover
(3month)
(%)
POWER
NTPC 99.35 4.97
50787000 13.55 0.00 0.54 87.40 89.49
POWERGRID 190.15 (2.19) 16876000 35.92 2.06 0.83 93.42 87.85
TATAPOWER 75.95 21.04
88209000 (14.30) 5.17 0.55 92.29 95.64
TORNTPOWER 318.00 3.03
3204000 (14.56) 2.46 0.29 97.09 94.89
REAL ESTATE
DLF 233.85 26.13
26413200 (5.17) 5.60 0.47 87.73 93.31
TELECOM
BHARTIARTL 511.90 8.74
98663853 3.36 5.63 0.62 98.83 98.12
IDEA 10.75 7.50
917420000 86.77 12.24 0.47 92.43 88.53
TEXTILES
PAGEIND 27682.00 20.83
66120 (26.70) 3.39 0.05 89.70 90.00
SRF 5577.25 9.17
306500 (39.84) 0.82 0.10 93.59 94.11

Derivatives Rollover Report
For Private Circulation Only
7
Technical and Derivatives Team:
Sameet Chavan Chief Analyst - Technical & Derivatives sameet.chavan@angelbroking.com
Ruchit Jain Senior Analyst - Technical & Derivatives ruchit.jain@angelbroking.com
Rajesh Bhosale Technical Analyst rajesh.bhosle@angelbroking.com
Sneha Seth Derivatives Analyst sneha.seth@angelbroking.com
Research Team Tel: 022 - 39357600 (EXTN - 6844) Website: www.angelbroking.com
For Technical Queries E-mail: technicalresearch-cso@angelbroking.com
DISCLAIMER
Angel Broking Limited (hereinafter referred to as “Angel”) is a registered Member of National Stock Exchange of India Limited,
Bombay Stock Exchange Limited and Metropolitan Stock Exchange Limited. It is also registered as a Depository Participant with
CDSL and Portfolio Manager and Investment Adviser with SEBI. It also has registration with AMFI as a Mutual Fund Distributor.
Angel Broking Limited is a registered entity with SEBI for Research Analyst in terms of SEBI (Research Analyst) Regulations, 2014
vide registration number INH000000164. Angel or its associates has not been debarred/ suspended by SEBI or any other regulatory
authority for accessing /dealing in securities Market. Angel or its associates/analyst has not received any compensation / managed
or co-managed public offering of securities of the company covered by Analyst during the past twelve months.
This document is solely for the personal information of the recipient, and must not be singularly used as the basis of any
investment decision. Nothing in this document should be construed as investment or financial advice. Each recipient of this
document should make such investigations as they deem necessary to arrive at an independent evaluation of an investment in the
securities of the companies referred to in this document (including the merits and risks involved), and should consult their own
advisors to determine the merits and risks of such an investment.
Reports based on technical and derivative analysis center on studying charts of a stock's price movement, outstanding positions
and trading volume, as opposed to focusing on a company's fundamentals and, as such, may not match with a report on a
company's fundamentals. Investors are advised to refer the Fundamental and Technical Research Reports available on our website
to evaluate the contrary view, if any.
The information in this document has been printed on the basis of publicly available information, internal data and other reliable
sources believed to be true, but we do not represent that it is accurate or complete and it should not be relied on as such, as this
document is for general guidance only. Angel Broking Limited or any of its affiliates/ group companies shall not be in any way
responsible for any loss or damage that may arise to any person from any inadvertent error in the information contained in this
report. Angel Broking Limited has not independently verified all the information contained within this document. Accordingly, we
cannot testify, nor make any representation or warranty, express or implied, to the accuracy, contents or data contained within this
document. While Angel Broking Limited endeavors to update on a reasonable basis the information discussed in this material,
there may be regulatory, compliance, or other reasons that prevent us from doing so.
This document is being supplied to you solely for your information, and its contents, information or data may not be reproduced,
redistributed or passed on, directly or indirectly.
Neither Angel Broking Limited, nor its directors, employees or affiliates shall be liable for any loss or damage that may arise from or
in connection with the use of this information.
